Analytics
Joomla 4, 5, 6
Updated 3 Oct 2023
1 min read
Analytics provide valuable insights into the performance of your online store, helping you make informed decisions and understand your store's growth. EasyStore offers a comprehensive analytics section that provides a clear overview of various metrics.
Accessing Analytics
To access Analytic, go to Joomla Dashboard > Components > EasyStore > Analytics. This will lead you to the analytics interface.
Overview Metrics
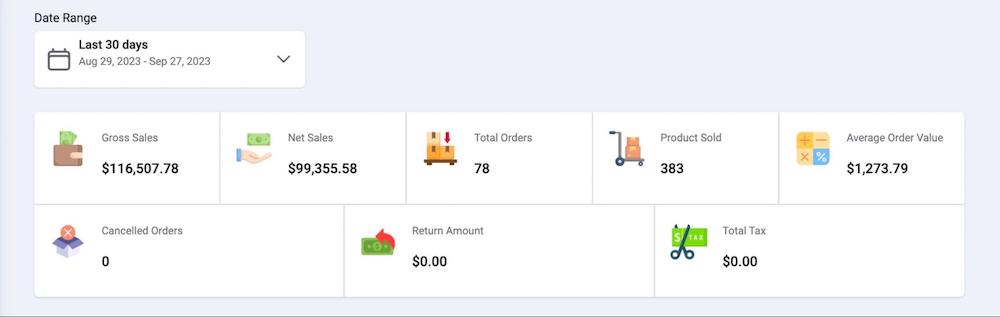
The analytics dashboard provides an overview of key metrics that help you understand your store's performance:
Date Range: Choose a specific date range for which you want to view analytics data.
- Gross Sales: The total sales revenue before deducting returns, refunds, and taxes.
- Net Sales: The total sales revenue after accounting for returns and refunds.
- Total Orders: The overall number of orders placed during the selected date range.
- Products Sold: The total quantity of products sold within the chosen date range.
- Average Order Value: The average value of each order placed during the selected date range.
- Canceled Orders: The number of orders that were canceled.
- Return Amount: The total amount refunded due to returns.
- Total Tax: The cumulative amount of taxes collected from sales.
Top Selling Items and Categories
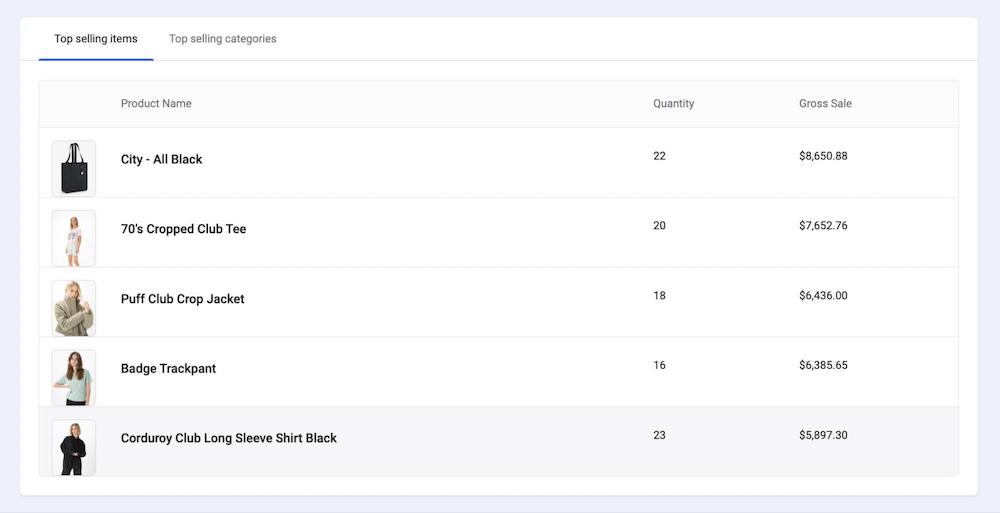
- Top Selling Items: A list of the top-selling items, including their names, quantities sold, and gross sales.
- Top Selling Categories: A breakdown of the top-selling categories, helping you understand which product categories are performing well.
Overview Graph
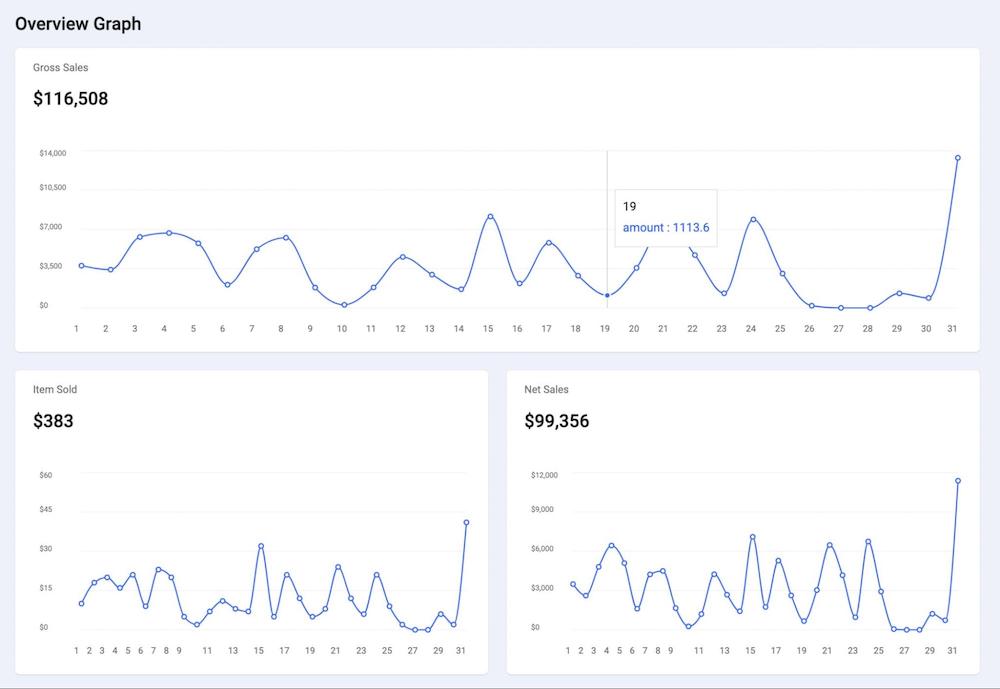
The overview graph visually represents your store's performance over time:
- Gross Sales: A line graph showing the trend of gross sales over the selected date range.
- Net Sales: A line graph illustrating the trend of net sales.
- Taxes: A line graph displaying the trend of tax collections.
- Refunds: A line graph representing the trend of refunds issued.